 |
- Citing ASTRO
- Input Formats
- Minimum number of genes per cluster
- Minimum fold change
- TF-gene association data (optional)
- Species (optional)
Citing ASTRO:
Please cite one of the following papers. The second reference describes the algorithms and methods used in ASTRO.
- Alain B.Tchagang, Thomas McGinnis, Panayiotis V. Benos, "ASTRO: a web server for analyzing and visualizing short time-series gene expression data", Nucleic Acids Research (2008) submitted.
- Alain B. Tchagang, David Corcoran, Panayiotis V. Benos, "Extracting Biologically Significant Patterns from Short Time-series Gene Expression Data using Order Preserving Clustering", (2008) in preparation.
Input Formats:
ASTRO currently supports only simple ASCII text tables (tab-delimited) as input for gene expression data. The first line of the table should contain the labels of the time points (also tab-delimited). Subsequent rows should contain the (normalized) microarray data preceeded by the gene ID.
To create such a file from a Microsoft Excel spreadsheet, chose "Save As..." -> "Text" -> "Tab delimited".
For an example of a gene expression datafile,
click here.
Minimum number of genes per cluster:
It is a user specified variable. It is used to tell ASTRO the minimum number of genes that can be allowed in a cluster. The default value is 20.
Minimum fold change:
It is a positive variable defined by the user. Using that variable, ASTRO computes the maximum absolute value for each gene expression profile and removes the profiles with maximum absolute values less than the specified threshold. The default value for the minimum fold change is 1.
TF-gene association data:
The TF-Gene Association data input (when available) is used by ASTRO to evaluate the quality of the clusters based on the number of genes in the cluster associated with given TFs. The evaluation is performed with the Fisher's exact test. This is an optional input datafile. The currently supported format is a tab-delimited ASCII text file containing a table. The first row of the table contains the labels of each TF (starting at colmn #2). Each subsequent row contains the gene ID (column #1) and a series of 0s and 1s depending on whether a given TF has been associated with the corresponding gene.
To create such a file from a Microsoft Excel spreadsheet, chose "Save As..." -> "Text" -> "Tab delimited".
For an example of a TF datafile, click here.
Species:
The "Species" selection is another optional parameter. It is used by ASTRO to evaluate the quality of the clusters based on the number of genes in the cluster associated with a given GO process. The evaluation is performed with the Fisher's exact test. The GO processes used for each species come from here
Results:
ASTRO provides the results in a table format. The first column contains the cluster labels (ordered by number of genes). The second column contains the p-value calculated using the following formula:
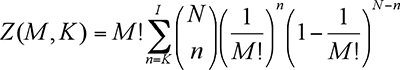
where N is the total number of genes, M is the number of datapoints and K is the number of genes in the given cluster.
If "species" was specified in the input, then the next column reports the most significant GO process associated with this cluster and the corresponding p-value. A link to all significant results is also provided. If a TF-gene association datafile was provided in the input, then the next column reports the most significant TF associated with this cluster and the corresponding p-value. A link to all significant results is also provided. Finally, a graphical view of the gene expression levels of all genes in the cluster is provided in the last column of the output.
If you have any further questions or suggestions, please contact Alain Tchagang (abt10@pitt.edu) or Takis Benos (benos@pitt.edu).
For technical problems please contact Kevin Bui (kvb2@pitt.edu)
|
| University of Pittsburgh Department of Computational Biology |