1. Introduction
Program enoLOGOS
generates LOGOs of transcription factor DNA binding sites from various
types of input matrices. It can utilize standard count matrices, probability
matrices or matrices of "energy" values (i.e., log-frequencies). In the
latter case, it will first convert the energy values into probabilities
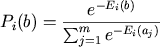
using the Boltzmann distribution, where the probability of base
b at position i is defined as:
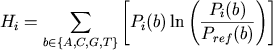
The height of the stack of symbols in each position is
calculated to be the relative entropy for this position:
Finally, the height of the stack of individual symbols
in each position is calculated to be proportional to their probability
in this position.
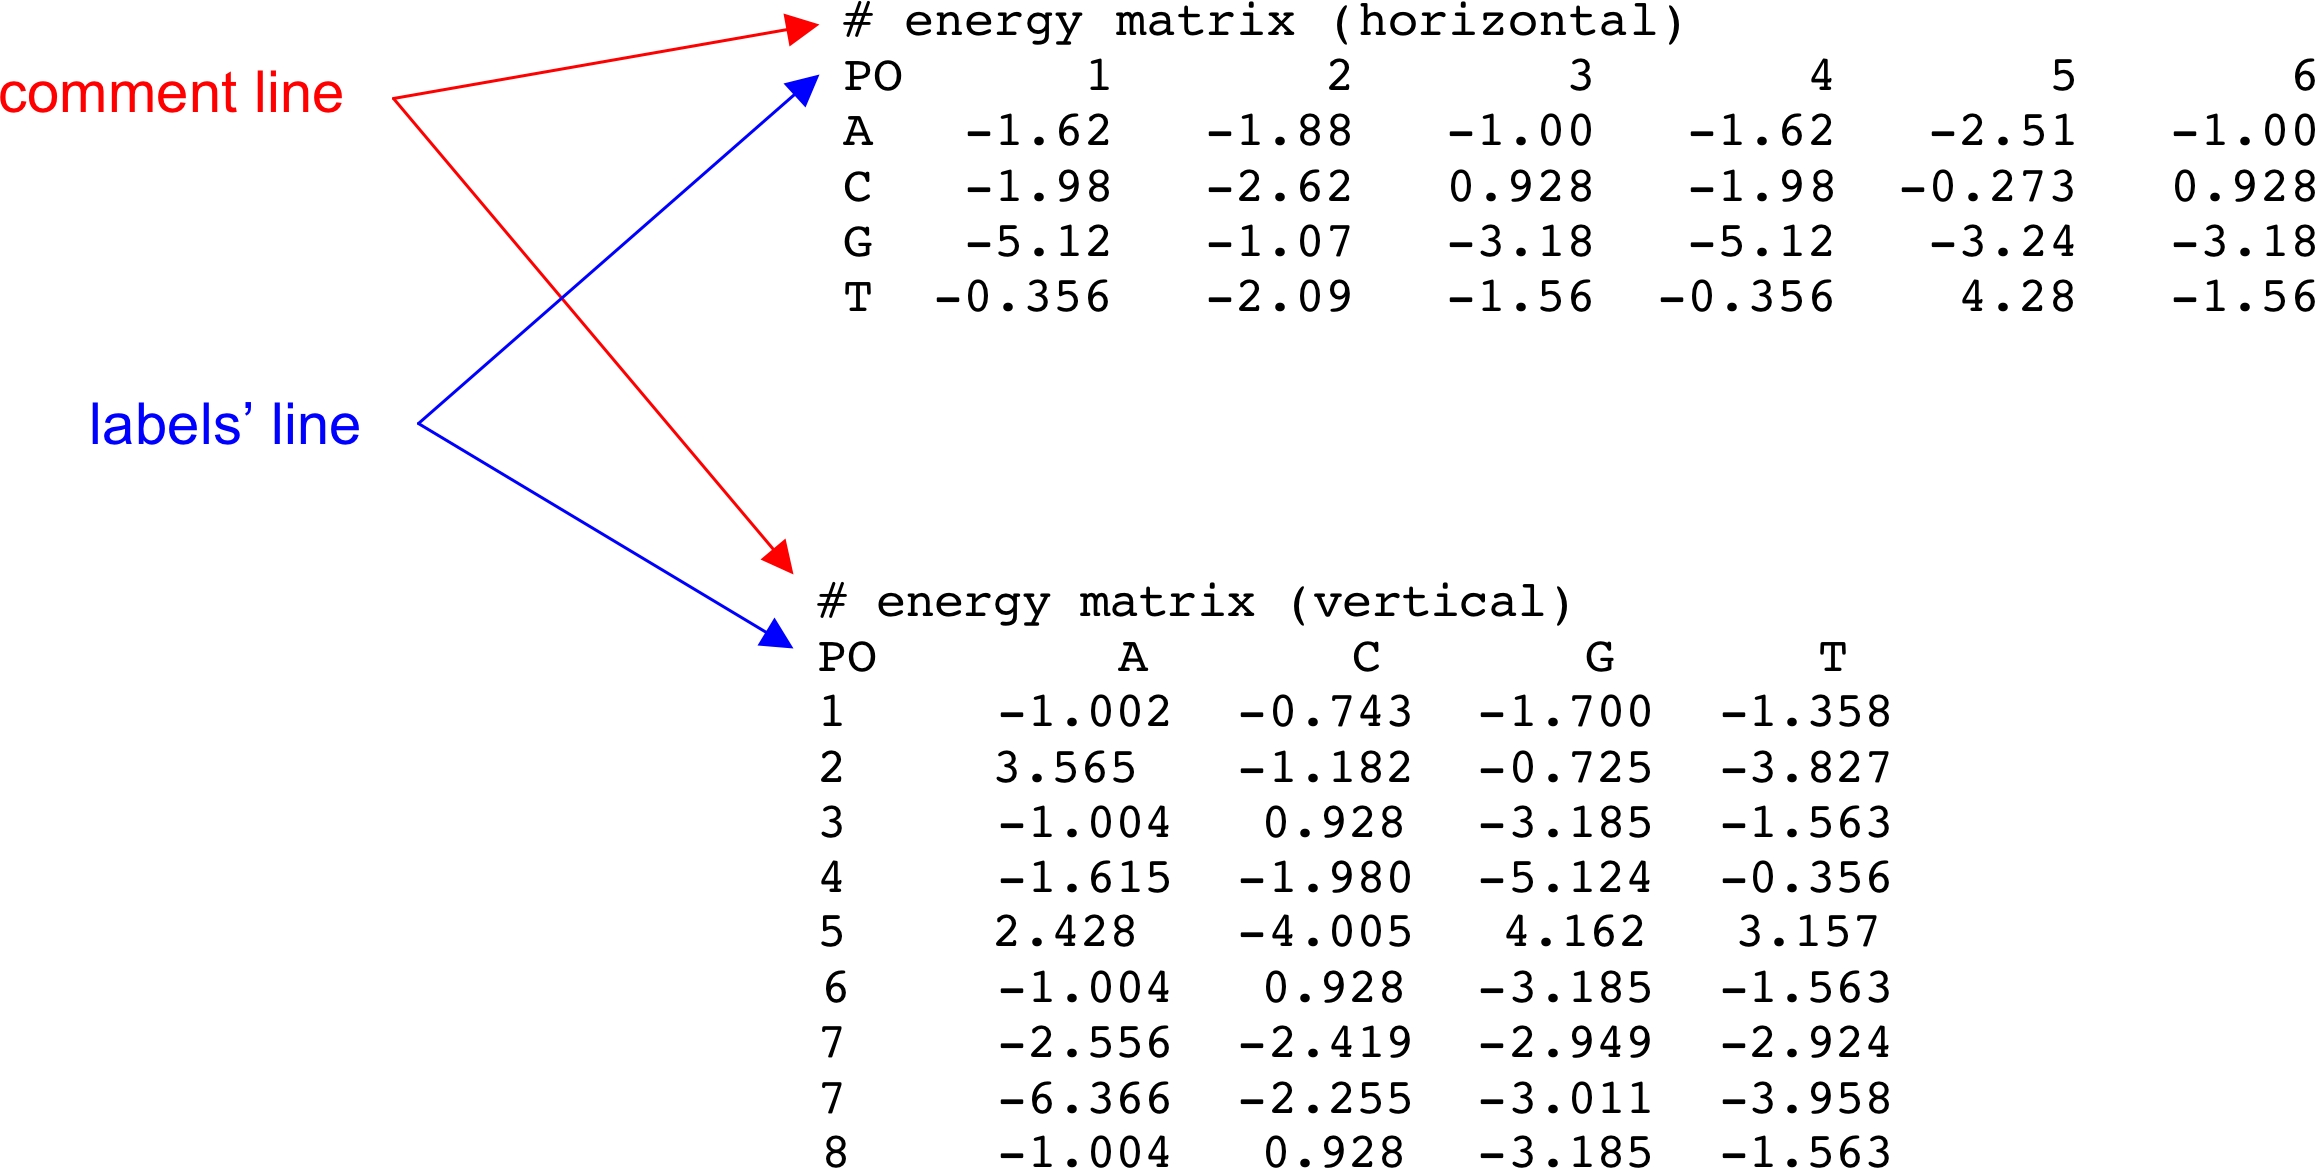
- Matrix input format:
The user can enter the weight matrix in horizontal or vertical
format; i.e., the rows will correspond to the base type or the
positions of the matrix, respectively.
Lines that are preceded by "#" are considered comment lines
and are ignored. A single matrix header line starting with "PO"
can specify position labels (horizontal matrices) or base types
(vertical matrices) of the logo columns. If a matrix header is
found, then the first item on each subsequent line will be used
as either the base type or position label of the horizontal or
vertical matrix, respectively. Examples of horizontal and vertical
matrices follow.
- Alignment input format:
The user can also enter a set of aligned DNA or RNA sequences in the
input. In this case the input sequences should be either in FastA
format or standard (raw) sequence alignment format. An alignment
matrix will be created from the aligned sequences. Any character
other than white space in an alignment (e.g., "-",
"." or "*")
designates insertion. All white space characters are ignored.
# example sequence alignment
LABELS = -2 -1 0 +1 +2 +3 +4 +5 +6
GCGCCACCG
GCGCAAGCC
GAGCCAACT
TCGCCCCCG
ACGCGACCG
GTGCCAACT
CCGCCGACT
GCGCAAGAC
GAGGCAACT
AAGACAGCC
CCTACACCG
GCCGCATCA
GCACAATCA
CAGCAACCG
- Weight type:
The user may need to specify the type of data in the weight matrix:
- unknown: The program will try to infer the input type as best it can.
- energies: Weights will be interpreted as energies and converted
to probabilities as defined above.
- alignment counts:
Counts will be converted to probabilities with the addition of pseudo counts (psi) proportional
to the background frequency of the letter/nucleotide, p(b). Each probability is calculated as:
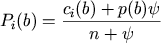
where c is the count of letter b in position i,
n is the total number of alignment counts and psi is typically set to 1.
- probabilities: Values for each position in the pattern will be normalized to sum to 1.
- arbitrary: Weights will be used "as is". To be plotted with
LOGO plot method "weights as entered".
- Energy units:
If the weight type is energies, then the energy units may need to be chosen.
- kT: The default.
- kcal/mol
- kJ/mol
- J/mol
- LOGO plot method:
The user can select the method for calculation of the height of
the symbol stacks. The two most popular are Shannon's entropy
(also known as information content) and relative entropy
(i.e., information content corrected for the background).
- relative entropy: H(i) as defined as above. Will generate Shannon's entropy
when prior probabilities are equiprobable.
- frequency: Letter heights will be generated from their calculated
probabilities (heights will sum to 1).
- weights as entered: When weight type is set to arbitrary,
letter heights will reflect the input weights.
- Log base:
The user specifies the preferred base for calculation of the
logarithms in the final plot.
- Title (optional):
The user specifies a title to be printed on the top of the plot.
- Axis labels (optional):
The user specifies whether the labels for the x-axis and y-axis will be printed.
- Scale letters by probability:
When "ON" (the default), each letter is scaled proportional to its probability
where the total height of the column is the relative entropy H(i). When "OFF",
letter heights will be proportional to the absolute value of relative entropy
contribution for that letter. Note that the latter method will generate LOGOs
where the bases with negative relative entropy are plotted upside-down.
- Wts (negate):
If the energies are negative, then they may be negated with this option
(all weights multiplied by -1) .
- Y-axis height:
The user specifies the maximum height for the y-axis. This can
be useful to users that want to print LOGOs of many patterns and
want them to be on the same scale for comparison purposes.
This value will be reset if the actual column heights exceed this value.
- X-axis, Y-axis:
Control for turning ON and OFF the plotting of x- and y-axis.
- Mutual information:
If the input data are aligned sequence (stack of sites or in FastA format),
then the mutual information can be calculated and displayed for each pair
of alignment positions.
Mutual information is the relative entropy between a joint distribution
(in our case, the two columns under comparison) and the product
distribution (of the independent columns).
- Aspect ratio:
This option allows control over the LOGO column height-to-width aspect ratio.
The default of 3, means that the height of the tallest column is 3 times the
letter width. Typically this will need to be increased when the total number
of positions exceeds 20 and decreased when the number of positions is less
than about 6.
- Symbol colors:
The user specifies the color of each symbol using the RGB system.
- %GC:
The user specifies the reference probabilities for the four bases
in terms of %GC content. E.g., for an organism with 40% GC,
p(A)=p(T)=0.3 and p(C)=p(G)=0.2.
3. Reference
|