ComiR Help 
|
Contents:
Citing ComiR:
- C. Coronnello, R. Hartmaier, A. Arora, L. Huleihel, K.V. Pandit, A.S. Bais, M. Butterworth, N. Kaminski, G.D. Stormo, S. Oesterreich, P.V. Benos (2012)
"Novel modeling of combinatorial miRNA targeting identifies SNP with potential role in bone density",
PLoS Computational Biology 8(12): e1002830. doi:10.1371/journal.pcbi.1002830
Supported Species:
ComiR currently supports four species: H. sapiens, M. musculus, D. melanogaster and C. elegans.
Choosing the species determines the set of genes on which ComiR evaluates the target prediction scores.
It is possible to add extra genes to the default list by using the panel "mRNA custom sequence input".
The following table contains the number of genes/miRNAs considered for each species. Download the FASTA file of the used
sequences by clicking on the cell of interest.
Genes' FASTA files contain the 3'UTR sequences downloaded from the ENSEMBL website (as in September 20, 2012).
When more than one 3'UTR sequence were associated to the same ENSEMBL gene ID, we used the longest sequence.
The header of each sequence contain information about:
ENSEMBL gene ID, ENSEMBL transcript ID, chromosome, start, end, strand and official gene name.
miRNAs' FASTA files contain the mature sequence of all the miRNA available from the miRBase website (Release 19).
An internal ID conversion tool is used to convert the old miRNA IDs with the updated ones.
In order to do not affect the analysis, we suggest to use the latest miRNA miRBase official ID.
miRNA Input:
ComiR allows miRNAs to be input as a list or in a table. The first html page shown after you submit the analysis will show how many miRNAs of the input are present in our database. In order to avoid miRNAs not included in the analysis, be sure that all the miRNAs belong to the selected species, and that their IDs refer to Release 19 of miRBase. Please email me (clc196(AT)pitt.edu)if you are interested in miRNAs not included in our database.
List
When you input a list of miRNAs, by using the dedicated panel or an input file, put each miRNA in a separate row. No header row is necessary.
Example:
hsa-let-7a
hsa-let-7a*
hsa-miR-127-5p
hsa-miR-18b
ComiR allows to use the list of miRNAs as single miRNAs or as a set of miRNAs. This choise can be selected in the More Options panel.
When single miRNAs is selected, ComiR will compute for each gene of the selected species one targeting score for each single miRNAs in the list.
Example results with single miRNAs option:
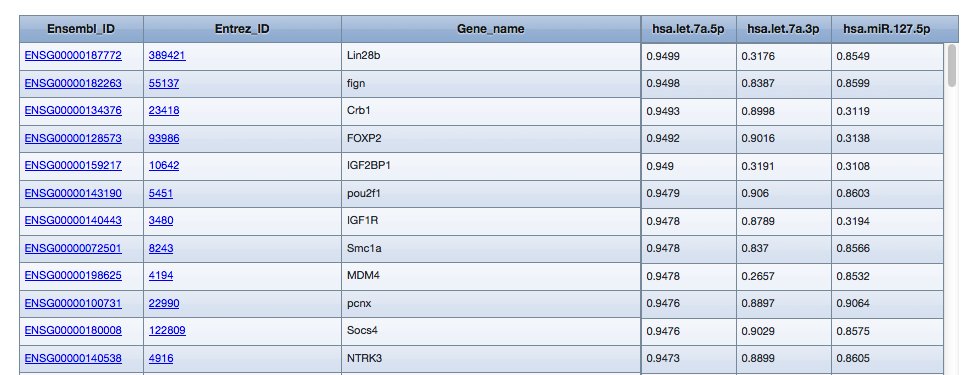
...
When a set is selected, ComiR will compute one single score to each gene, by assigning to each miRNA the same relative expression level (1/N where N is the number of miRNAs in the input list).
Example results with a set option:
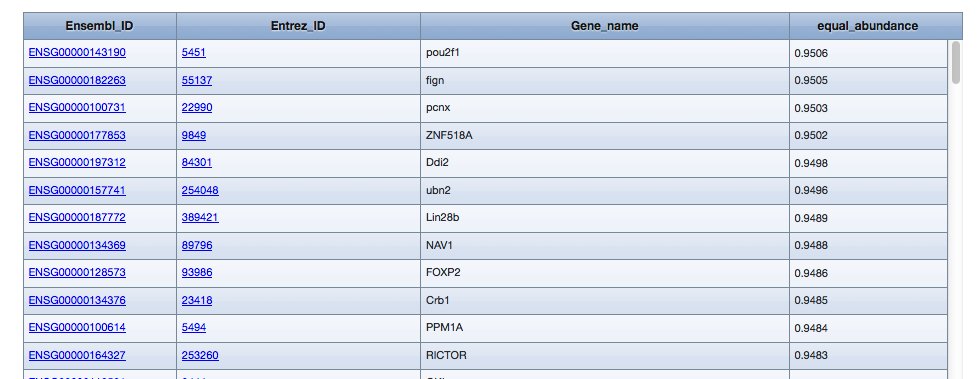
...
Table
Comma separated values format is accepted. First column has to contain the miRNA ID. Then, each successive column has to contain the abundance level of the miRNAs in any sample the user is interested in. If the miRNA is not expressed in a sample, use 0.
Example:
miRNA,set_1,set_2
dme-miR-14,3968,1543
dme-miR-2a,1361,0
dme-miR-11,916,4032
dme-bantam,1183,0
In this case, ComiR will compute one ComiR score for each sample provided in the input table.
Example results:
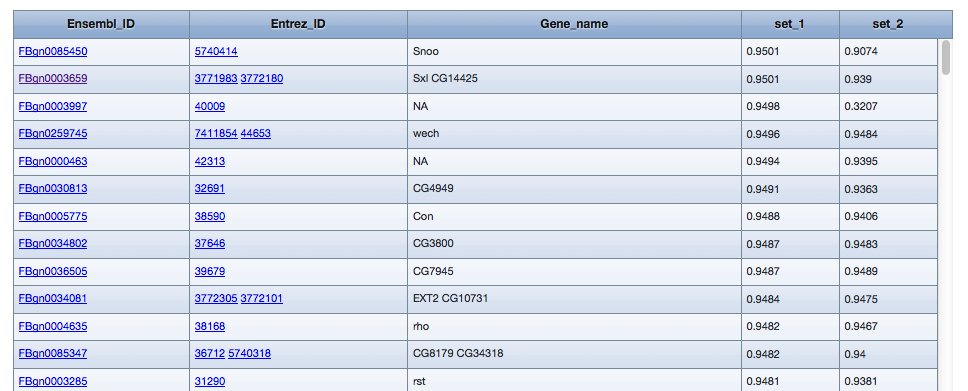
...
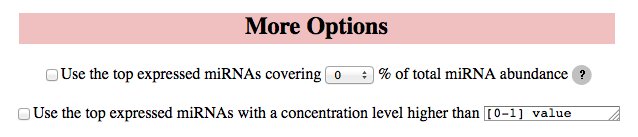
miRNA filtering:
ComiR allows to select the top expressed miRNAs to be used for further analysis, by using the check box in the More Options panel. This option is valid only if the miRNA input is in the table format and contains the miRNA abundance level information. The user can select the percentage coverage level to be used to select the top expressed miRNAs in each sample of interest or the concentration level threshold. This options are useful when microarray expression data is available for a big number of miRNAs and the user wants to focus on few top expressed miRNAs.
mRNA Input:
ComiR allows to include in the analysis any custom mRNA sequence. The accepted format is FASTA format. Be sure to assign a different name to each mRNA sequence in input.
When custom mRNA sequences are present as input, ComiR runs TargetScan, miRanda and PITA publicly available scripts to compute the binding site information with all the miRNAs in the input list/table. Then, the custom sequences are treated as all the other 3'UTR sequences in the database.
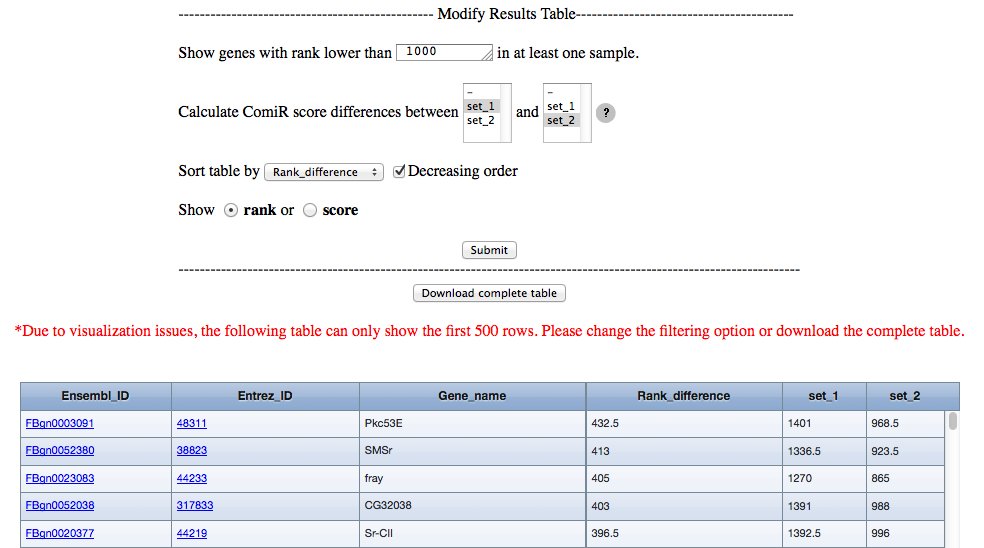
Results:
ComiR results file contains the ComiR scores computed for each gene considered in the selected species and for each sample miRNA information given as input. Due to visualization issues, only the first 500 rows can be displayed. The visualized results table can be modified by the user in the following ways:
By choosing to visualize the ComiR scores or the rank with respect to the ComiR score assigned to each gene.
By changing the threshold in ComiR score (or in ComiR rank) used to filter out all the genes that are not predicted as targets in any of the samples (according to the chosen threshold)
By sorting the table with respect to any of the columns.
The results' table contains the following columns: Ensembl ID, Entrez ID, Official Gene Name and the ComiR scores (ranks) obtained using miRNA abundance level informazion in each input sample. If more than one ComiR score (rank) has been calculated, the user is allowed to calculate the ComiR score (rank) difference between any two samples, and this value is shown in the Score_difference (Rank_difference) column. Multiple selection is allowed to compute score (rank) difference between the average scores (ranks). If the user compares two groups of samples composed by three or more samples each, the Wilcoxon rank-sum test will be performed, and a column containing the resulting p-values will be added in the table.
...
For comments or suggestions, please contact Claudia Coronnello at clc196(AT)pitt(DOT)edu.